Many Telegram Channel Members have this Question as how to Read my Charts as they are new to Harmonics.
I will explain in step by step as how to make understand and use my charts .

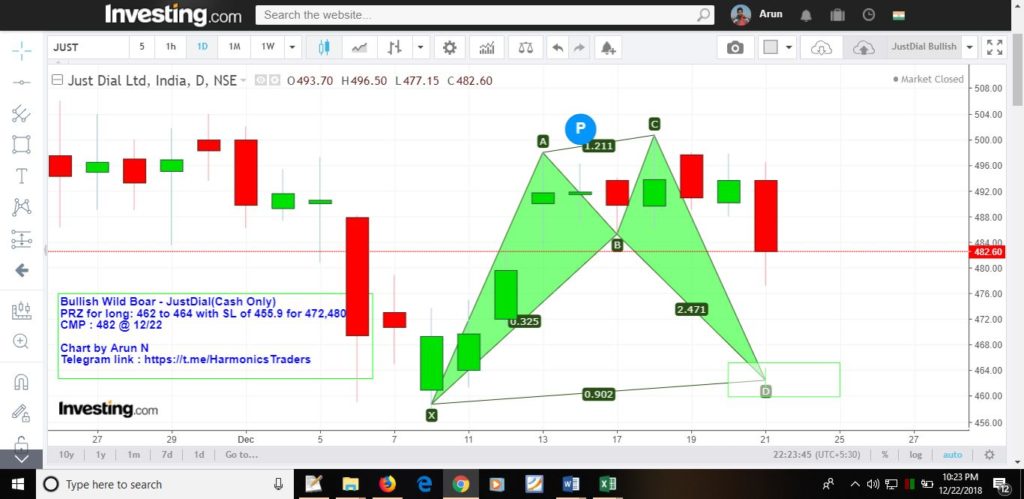
1)Above Chart is Bullish Wild Boar in Daily Time on Just Dial . Current Market Price on 12/22/2018 is 482 .
Bullish Pattern on the Chart , We buy them and
Bearish Pattern on the Chart , We Sell them .
2)Here in the above Chart , we see Bullish Wild Boar , Means we will only be Buying
3)Next question is where to buy ? We buy in the PRZ ( Potential Reversal Zone) ie 462 to 464 . Question arises , when stock is currently trading at 482, how can I buy near 464 levels .
4)We wait for our PRZ numbers strictly to Enter. So If the stock falls to 464 from 482 , we will buy.
5)Some Ask , since current Market price is 482 and we buy near 464 , why cant I sell now near 482 and book profit – > Strictly Not allowed as based on Harmonics, we trade only in Reversal and wait for our PRZ to enter. Hope Now its Clear !


